
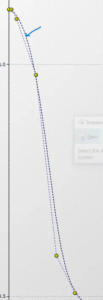
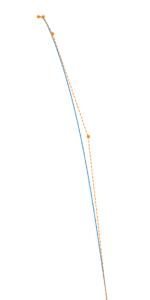
If I use this command query(Host.foilHolder().foilDefinition(0).elementDefinition(1).chordDefinition().CPx(2)), and then consider the obtained CPx/CP tuple and the tStations knots vector to generate the chord B-Spline in Python or Rhino, I don’t get the curve I see in the Chord/Sweep window in the Gomboc GUI.
Is it expected? If so, how can I explain the difference?
Your observation is as expected.
Internally, there is an intrinsic spline co-ordinate t, which typically varies from 0 to 1 along the length of the spline element. All properties of the foil element are referenced to that intrinsic co-ordinate, including the rondure – which effectively defines the girth length. For a ‘new’ foil, the relationship between t and girth length might in theory be linear, but in general it is not, and Gomboc maintains a map of t to girth length. This map changes whenever a control point on the rondure is moved.
However, to make it easier for users to see the physical shape of things like chord and twist, we plot these properties in the GUI against the girth length, using Gomboc’s internal map of t to girth length. This means that what is a B-Spline internally might not look like a classic B-Spline shape in the chord or twist view – it is a B-Spline transformed by the t to girth length map.
Why do we do this? Two reasons:
- By mapping each property to a knot vector coordinate, rather than a girth length, local design changes to a foil remain local. For instance, if you stretch the tip, or add a bit more curvature in one region of the foil (thereby changing its total girth length), features like local twist and chord don’t get redistributed over the entire foil. The area that is being manipulated may get stretched, and that part of the t to girth length map changes, but regions remote from this remain unaffected – which is what we’ve found designers prefer
- By keeping all aspects of the geometry, including rondure, chord, twist, referenced to the same knot vector, the geometry remains. consistent and more predictable when exported as a 3D IGES. Ultimately the 3D foil is generated by lofting through sections, and with a consistent knot vector, the location of those sections is uniquely determined. If each property had a different intrinsic basis, we would either have to insert numerous additional sections, or approximate some properties by interpolating between them. Either way, the resulting foil would not be an exact match to its defining property curves.
Finally, it is important to note that the control points of chord or twist do not in reality have any specific x-coordinate. We give the yellow dots them a nominal x-coordinate in the graphs so you have something to grab hold of and move, but in reality you’re changing a parameter which has influence over a span of girth coordinates. It would actually be more correct in the GUI, instead of drawing yellow dots, to draw yellow bars that spanned over a range of girth, and could be dragged up and down. However, in practice, we pick a nominal x at which to place the yellow dots, which is near the middle of the region of influence covered by that control point.